Statistics visualised
Energy consumption of industry, 2024
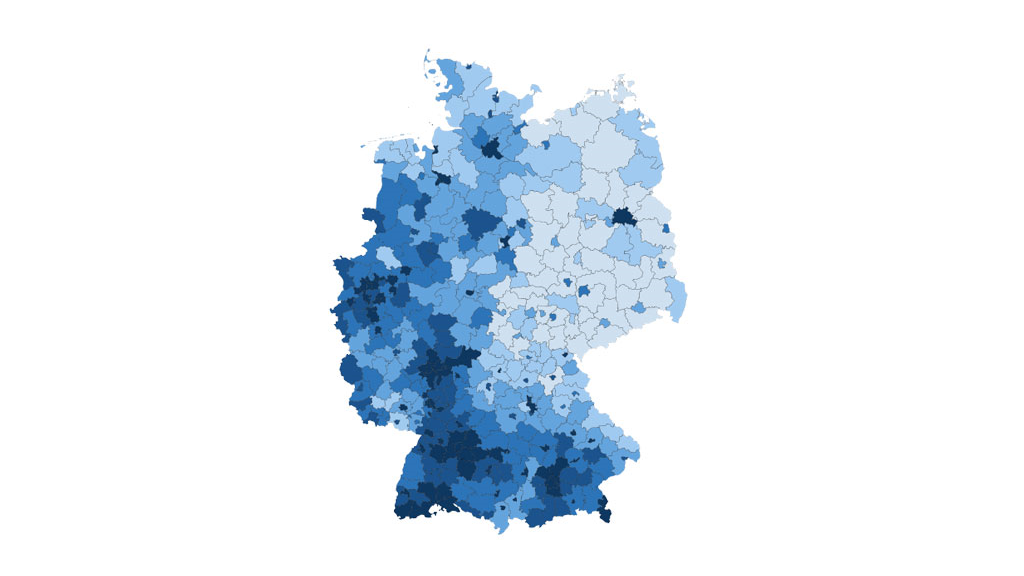
This interactive map shows the energy consumption of industry in 2024 by district. The detailed information provided for districts is broken down also by energy source: coal, heating oil, natural gas, renewable energies, electricity, heat and other energy sources like other gases and waste and other mineral oil products.

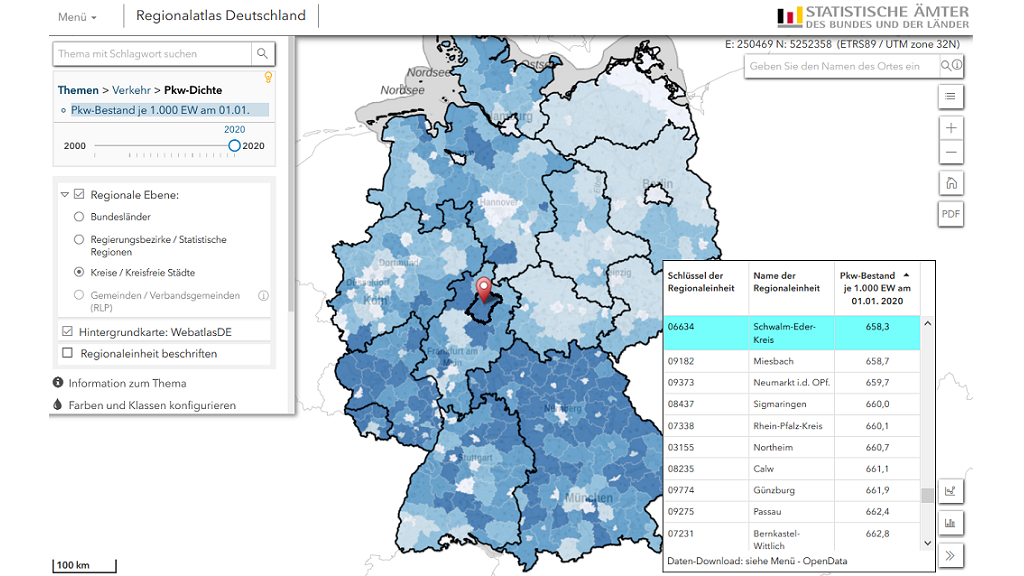
Regional Atlas for Germany
The new edition of the Regional Atlas for Germany (only in German) of the statistical offices of the Federation and the Länder visualises more than 160 indicators from 20 subject areas for Länder, administrative regions, towns not attached to an administrative district and rural districts. This makes it even more easy to draw supraregional comparisons also at the municipality level. The Regional Atlas is based on the Regional Database for Germany.
Experimental data Interactive grid map on "Experimental georeferenced population figure"
To meet the growing demand for small-area population data, experimental georeferenced population figures were compiled based on intercensal population updates and using mobile network data. In a distribution procedure, the results of intercensal population updates were redistributed at the municipality level to a 1x1 km grid for the whole of Germany by means of mobile network data.
 2022)")
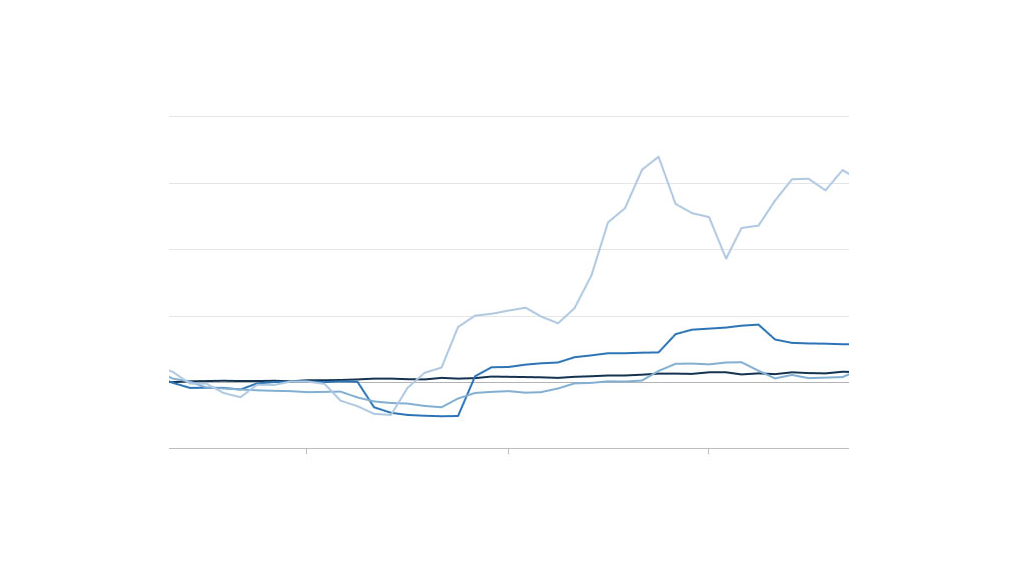
Brexit monitor
On January 1, 2021, a partnership agreement negotiated between the European Union (EU) and the United Kingdom provisionally came into force. With the exit from the EU's single market and customs union, the Brexit process has now been finalized. Our Brexit Monitor tracks developments in the United Kingdom based on selected socioeconomic indicators.

Interactive Accident Atlas
The interactive Accident Atlas of the statistical offices of the Federation and the Länder shows accidents at the regional level: Where do most traffic accidents occur in my town? Where am I most at risk when I go to work? Where did fatal accidents occur? The atlas shows accidents with personal injury involving passenger cars, motorcycles, bicycles and pedestrians.

Age structure of the population in Germany
Here we present results of the 16th coordinated population projection through an animated age pyramid. You may choose between four alternative variants which are based on different assumptions.


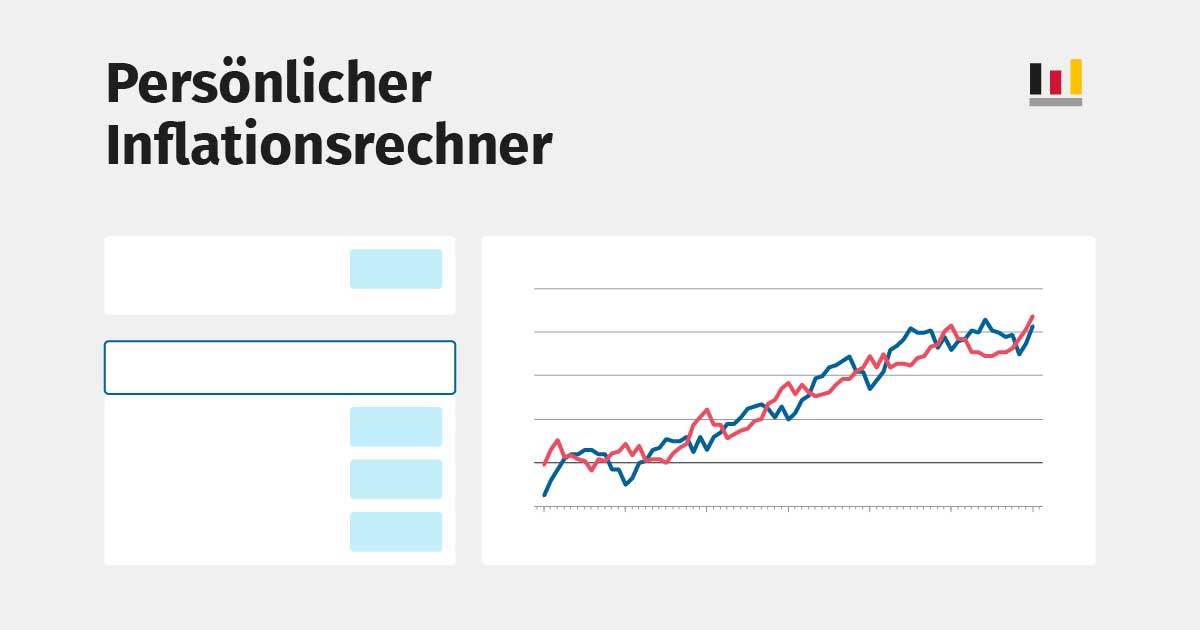
Personal Inflation Calculator
You can use this calculator to show the price development while weighting the different product types according to your individual consumption pattern.
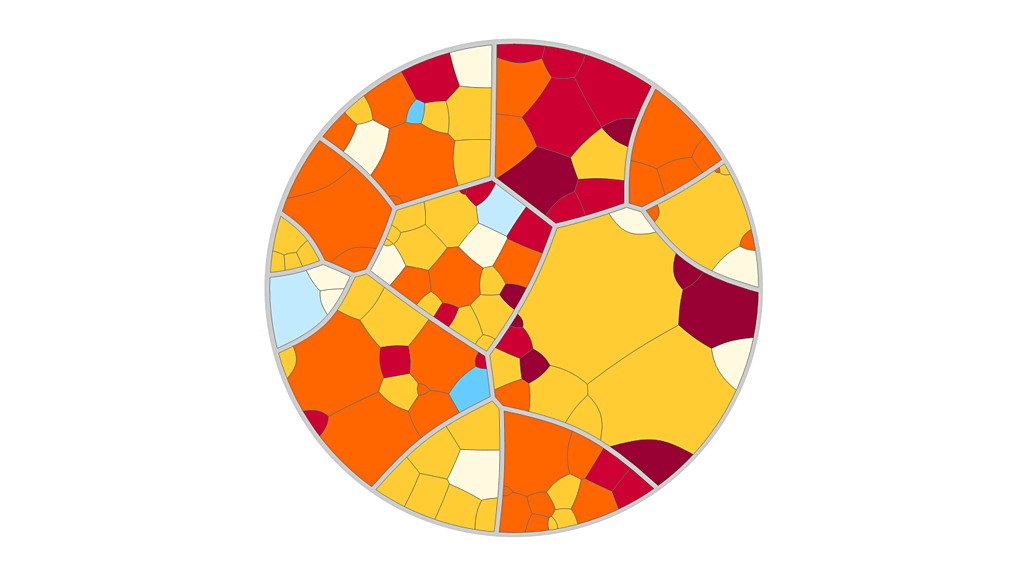
Price Kaleidoscope
The rate of price increase does not only depend on how prices change. The weights with which the price trends of the individual goods and services are reflected in the consumer price index are also important. The price kaleidoscope shows you the price trend and the weights of various product groups in the consumer price index.
Price Monitor
You can use our Price Monitor to get an overview of the most striking price changes regarding the goods and services frequently purchased.

Migration.Integration.Regions
The interactive map on Migration.Integration.Regions provides an overview of the regional distribution (administrative district level) of the foreign population and of people seeking protection in Germany.
2011 Census - Housing in Germany
Our interactive chart "Housing in Germany" (only in German) provides information on the housing situation.

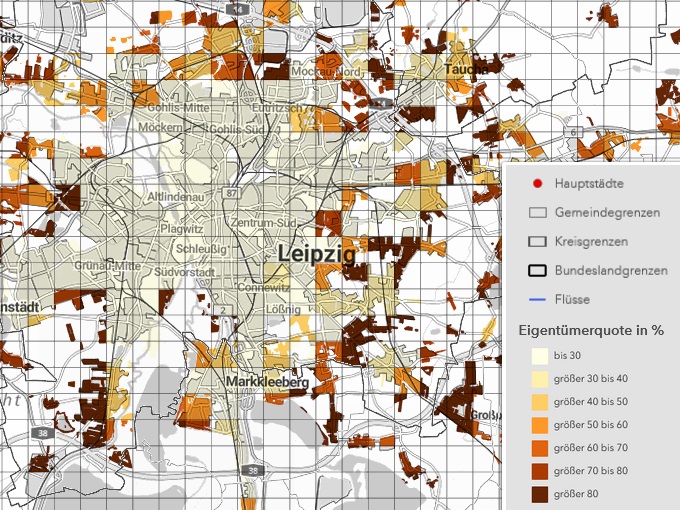
Census Atlas (1-km grid)
The interactive Census Atlas (only in German) of the statistical offices of the Federation and the Länder presents the 2011 Census results on the basis of a 1-kilometre grid.
Atlas of Agricultural Statistics (5 or 10-km grid)
The online Atlas of Agricultural Statistics (only in German) contains a total of 16 maps on agriculture, focusing among other things on the number of agricultural holdings, their utilised agricultural area and their livestock.

Thematic atlases
The statistical offices of the Federation and the Länder offer specific atlases on the following themes.
