Statistics visualized
EuropeEuropean Statistical Monitor
The European Statistical Monitor presents a selection of short-term indicators tracking developments within the EU and its member states.

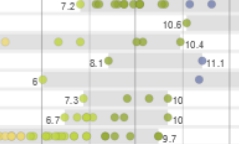
Regional Statistics Illustrated
This interactive application offers a range of visualization options for numerous indicators at regional level. Data is illustrated using maps, bar charts, boxplots and more. The application enables regional comparisons and trend analyses over time.
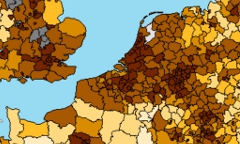
Regional atlas
The regional atlas contains choropleth maps taken from the Eurostat Regional Yearbook. European regions are analysed on the basis of 50 indicators. The Eurostat App My Region enables quick and easy access to regional EU data via smartphone or tablet.
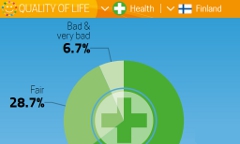
Quality of Life
This Eurostat tool illustrates the quality of life in the EU Member States based on key indicators on issues such as health, safety and housing. Info buttons provide more background and the compare button displays the EU minimum and maximum for each indicator.
Inflation Dashboard
This application analyses the trends in consumer prices in the European Union. It visualizes changes in the inflation rate for various products and countries and shows for example where energy prices have increased sharply or food prices have remained stable in recent years.

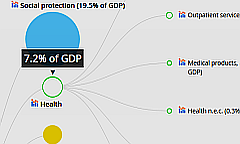
EU Government expenditure
This interactive data visualisation tool enables a detailed look at the government expenditure in the European Union and the individual EU Member States. The expenditure is presented according to the COFOG classification of the functions of government.
You in the EU
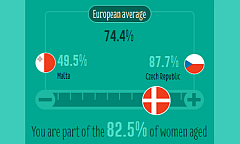
The infographic "You in the EU" enables you to compare your personal situation and your living conditions with men and women of your age group in your country or in a different EU Member State.
Tables, Graphs and Maps (TGM)
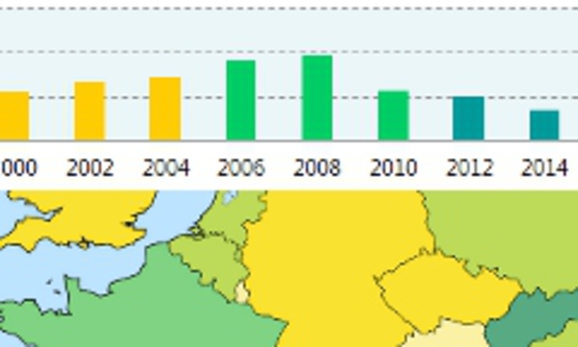
Eurostats data is divided into two main sections: Besides the more complex database, Eurostat offers easy-access main tables featuring frequently requested data. These are found under the heading tables by themes in the database and include visualization options.
Economic trends
This visualisation tool offers an overview of eight key economic indicators illustrating the development in recent years and enabling a look at the situation in each country compared to the EU average.

Country profiles
The country profiles allow for a direct comparison between two EU Member States on the basis of a large set of indicators. Links lead to the corresponding tables for data on other Member States. The profiles are also available as an app for mobile devices.

Country in a bubble
All EU and EFTA Member States are represented by a bubble in this application which shows how the countries compare based on roughly 60 social and economic indicators. The settings include a highlighting function for users wishing to concentrate on a certain country.

App Economy
The EU Economy App offers mobile device users access to the most important economic indicators for the EU and Eurozone countries. The app is available for iPhone, iPad and Android devices.

